
NSA Statistical Information
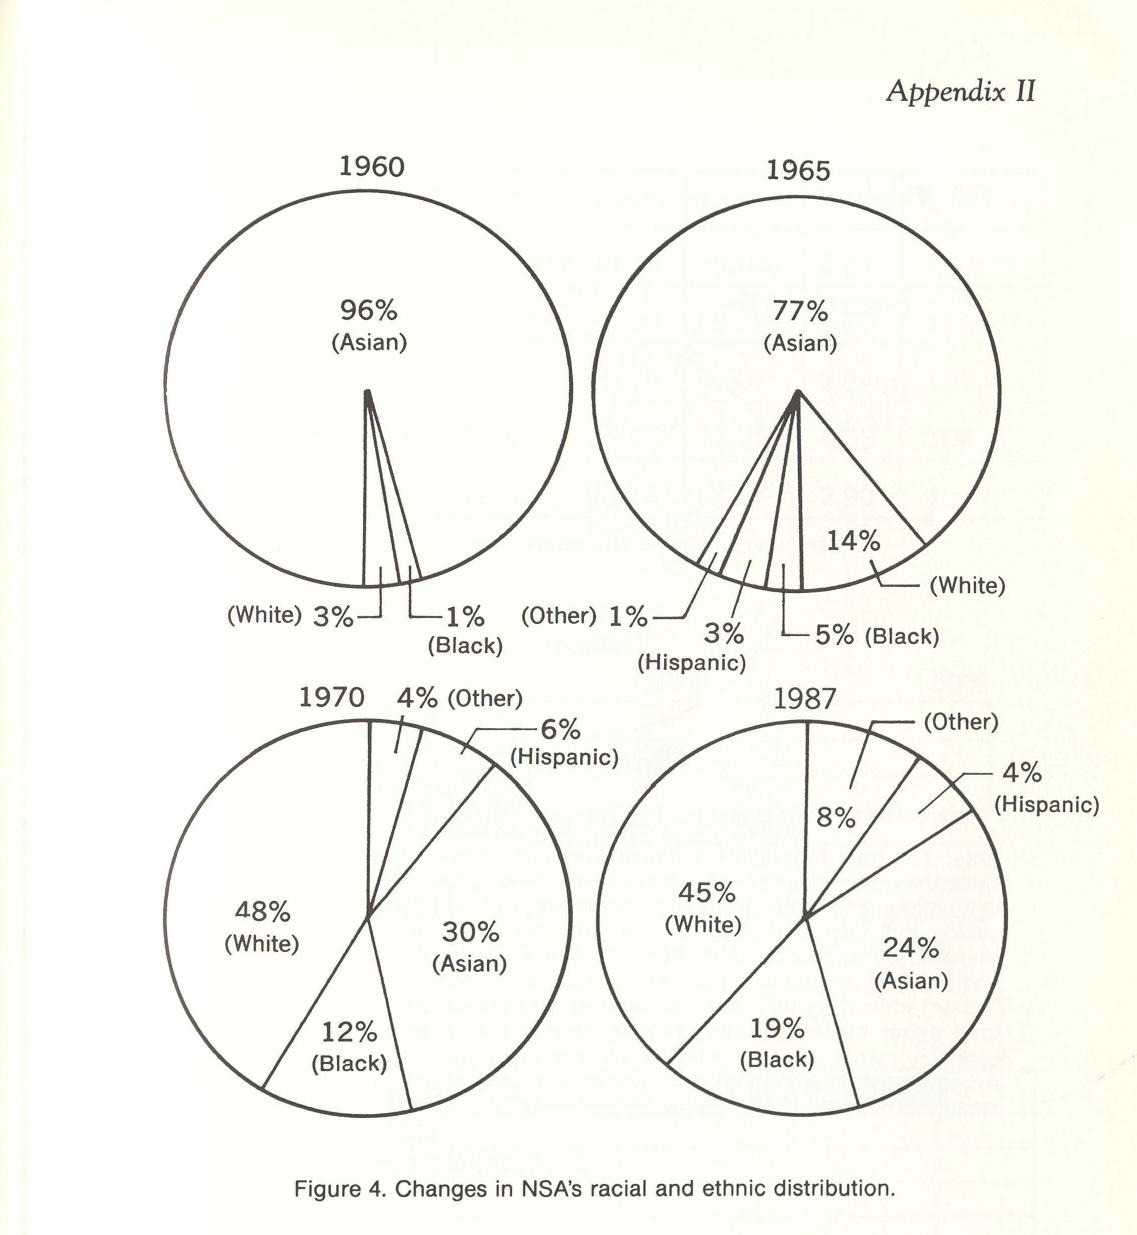
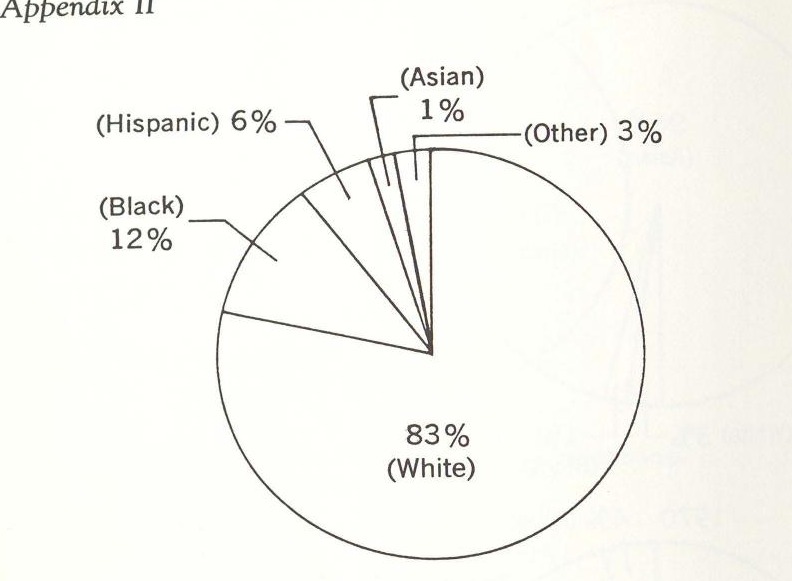
Note: The total represents a figure over and above 100% of the population, since the U.S. census of 1980 did not include Hispanic as one of the categories in its ethnic and national origins categories; rather, it had a separate question asking individuals whether or not they had Hispanic origins. People with Hispanic backgrounds, then, had to make an additional choice on the ethnic and national origins question. About 40% of Hispanics chose the category of “other” indicating that they considered themselves primarily Hispanic, rather than either black or white. This is one of the factors making the “other” category rather large. In addition to Hispanics, the “other” category includes American Indians, Hawaiians, Eskimoes, Aleuts, Asian Indians, and other smaller groups.
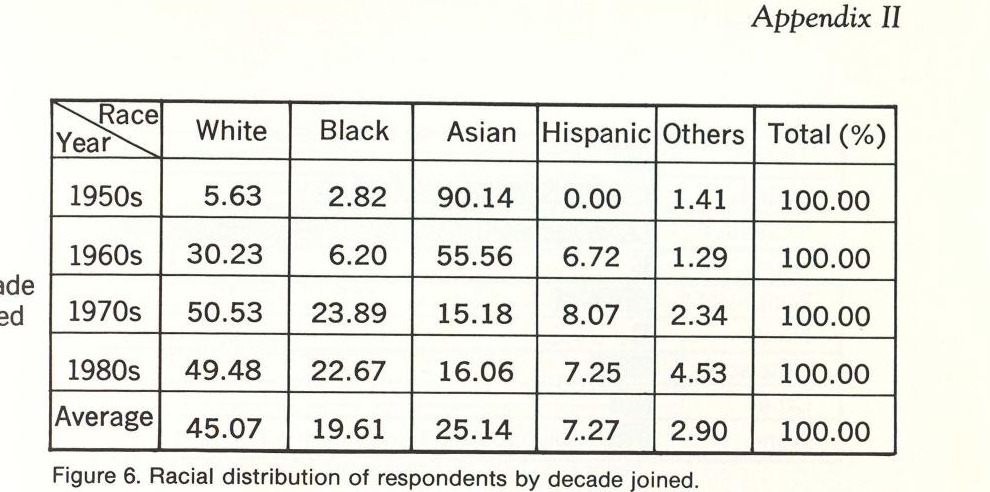
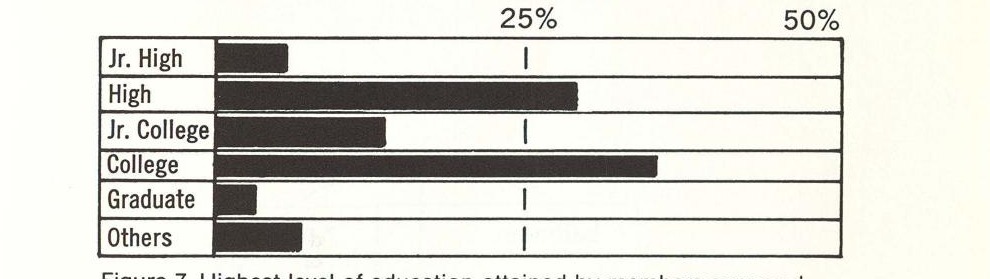
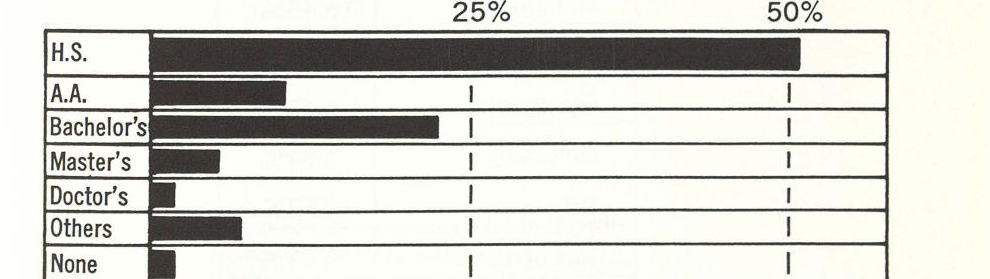
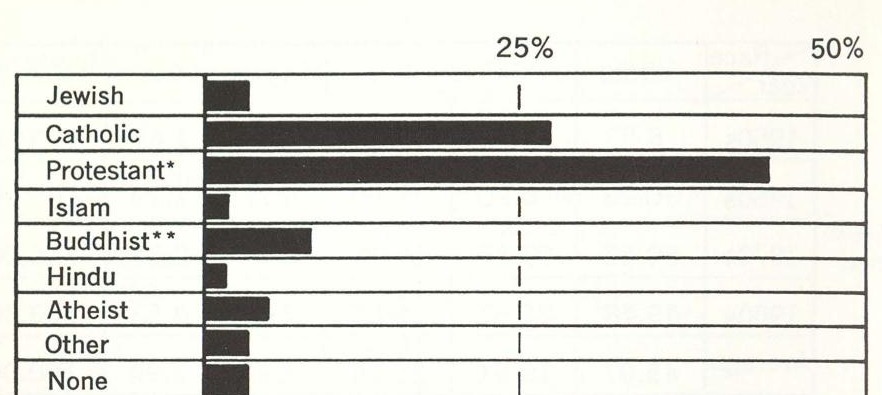
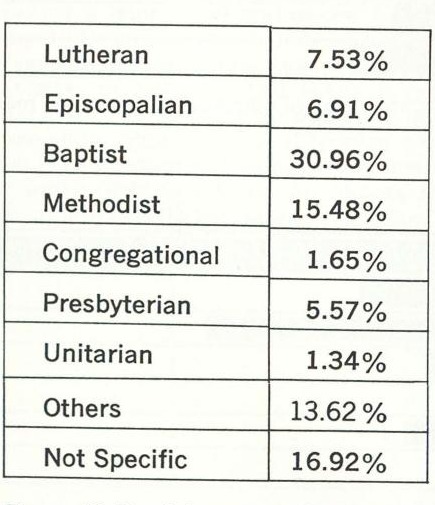
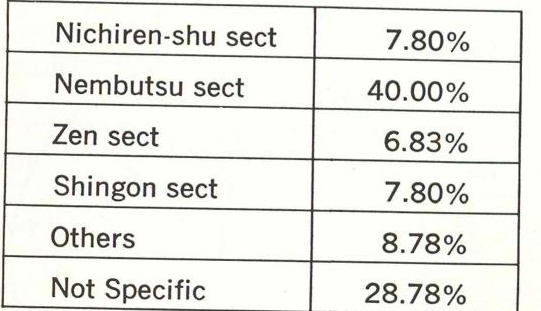
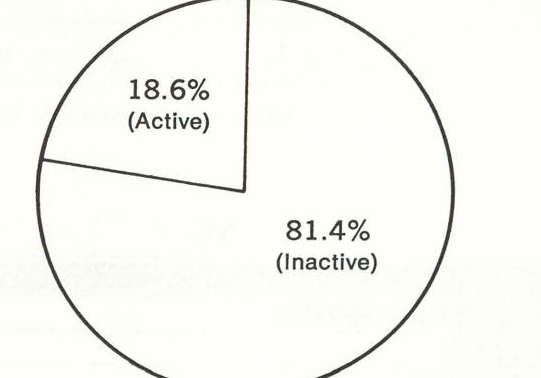
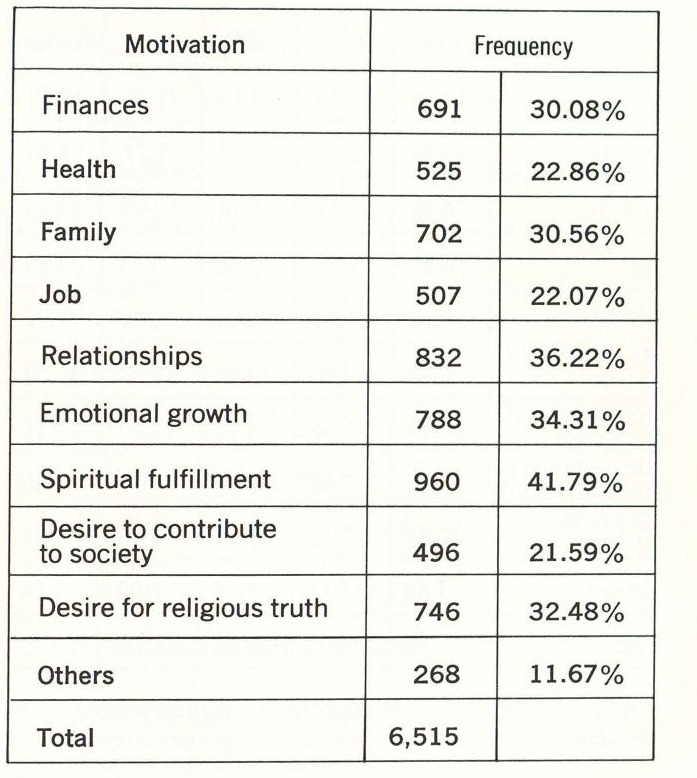
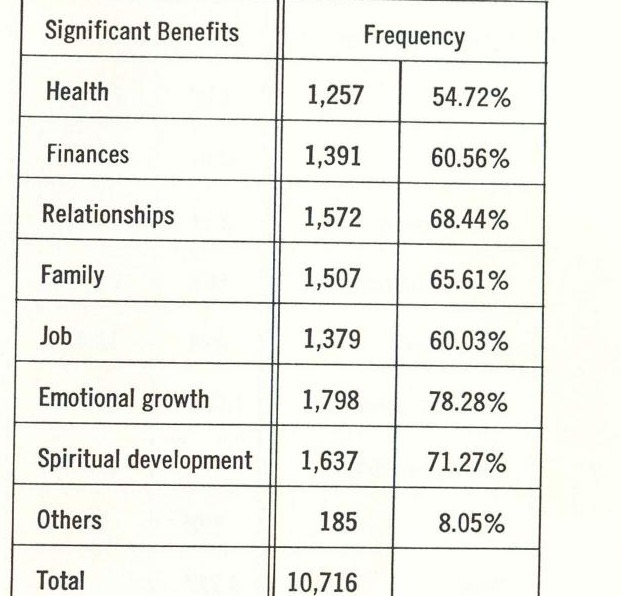
Note: The selection of more than one item by the same person accounts for a total percentage which is well in excess of 100%. Numerical totals refer to number of survey respondents.
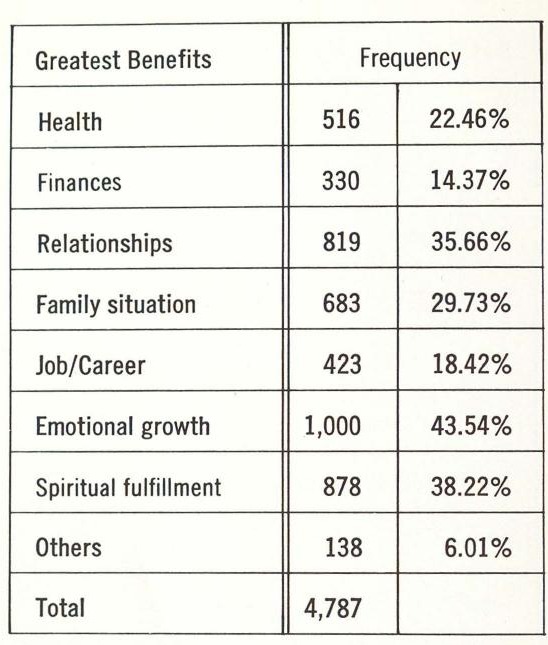
Note: The selection of more than one item by the same person accounts for a total percentage which is well in excess of 100%. Numerical totals refer to number of survey respondents.